When you click on links to various merchants on this site and make a purchase, this can result in this site earning a commission. Affiliate programs and affiliations include, but are not limited to, the eBay Partner Network.
okay so I got a baseline done on my 05' 6MT on a dynapack
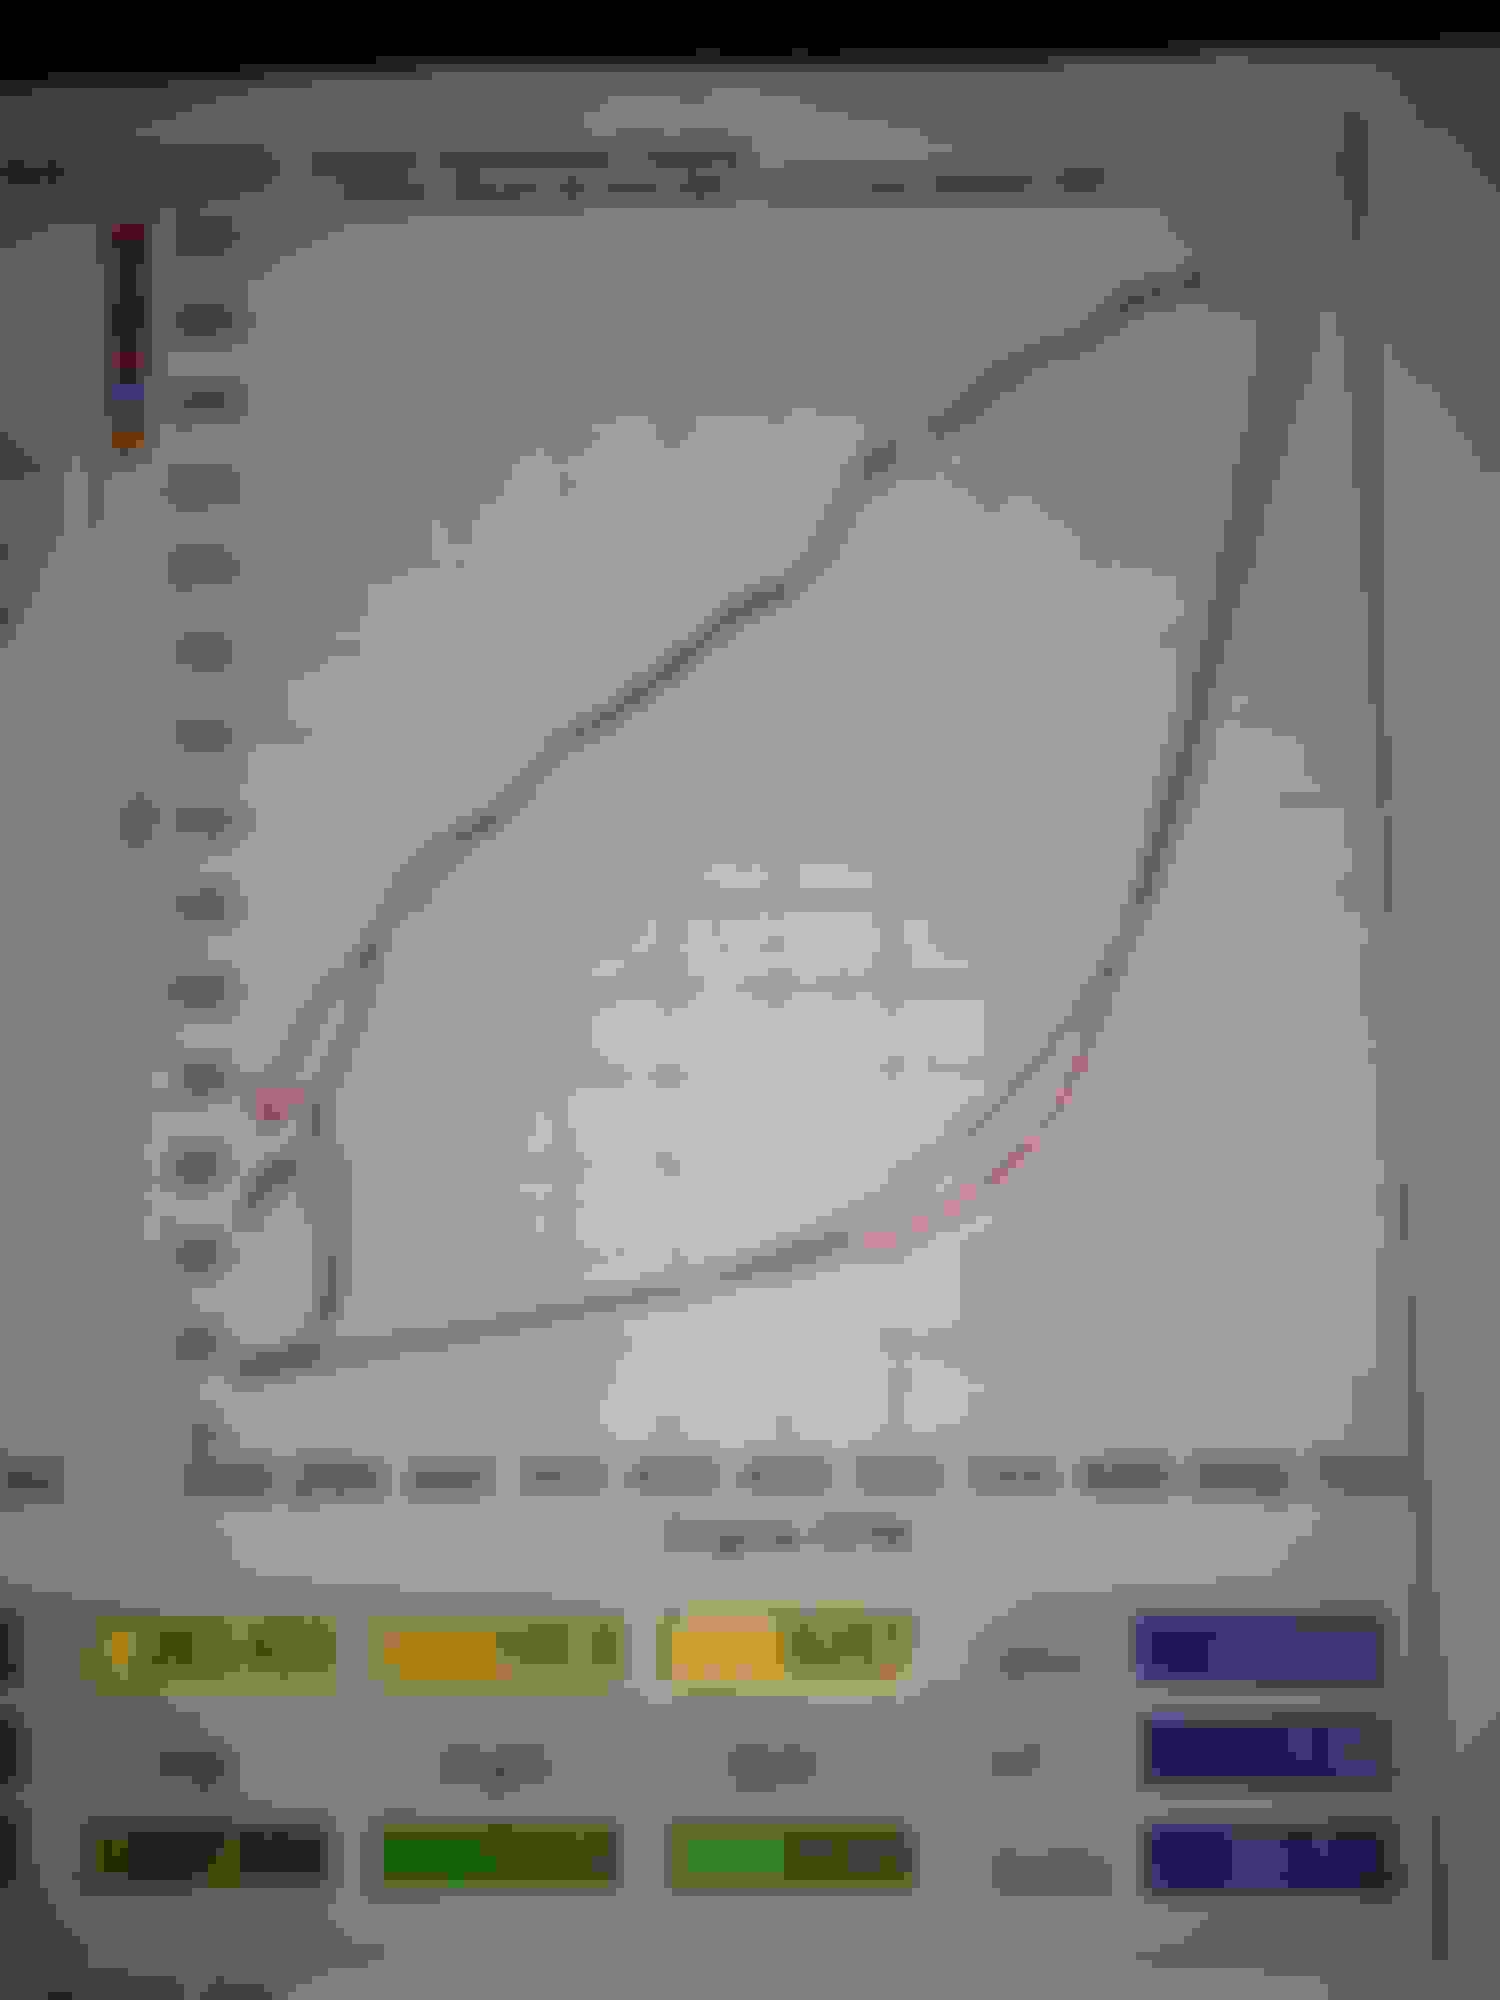
then installed motordyne full lineup of parts 5/16 mrev2 art pipes and last but not least the tdxv2 also had injen cai already installed. so here's the aftermath after up rev tune.
as you can see 50+ hp and 50+ tq in the midrange from bolt ons is not bad considering I hear this is only possible from forced induction. what do you guys think of this? all input is welcomed.
Last edited by sick_sixspeed; Jul 20, 2015 at 04:19 AM.
some guys with a hks blower barely see 60 hp increase. that is what I was referring to. and the chart is a little difficult to analyze but if you take the time to dissect it you can see their are more gains in the mid range than peak.
Those that are only seeing a 50-60hp gain with a supercharger are either doing it intentionally or their car is fvcked up.
I get the whole midrange thing but what I'm saying is the graph looks abnormal. There are some actual tuners on here so hopefully they can chime in since I don't know squat about smoothing or correction factors.
Good gains 25 hp/ 40 tq (not 50+/50+). The values are a bit skewed coincidentally in the midrange because you have a valley and peak at the same rpm. Church's reads about 10% higher than a Dynojet. Looks like a healthy car!
Good gains 25 hp/ 40 tq (not 50+/50+). The values are a bit skewed coincidentally in the midrange because you have a valley and peak at the same rpm. Church's reads about 10% higher than a Dynojet. Looks like a healthy car!
thanks for the input. if you look at 4.7k RPM's on both hp and tq charts to me it looks like an increase of over 40 close to 50 if not more. I understand there could be other factors none the less I am satisfied and preparing to go with a vortech setup soon.
that is exactly what he was saying at 4.7K RPM there was a trough on your base line and a peak on your new numbers. so it might be a little skewed. usually the lines mirror each other except the after line in just higher up on the chart. but good gains.
that is exactly what he was saying at 4.7K RPM there was a trough on your base line and a peak on your new numbers. so it might be a little skewed. usually the lines mirror each other except the after line in just higher up on the chart. but good gains.
the bottom line is the stock baseline with just injen cai which was running lean and had slight pinging. middle line is baseline after mods with a/f ratio adjusted. top line is after full tune. *** you can see the middle and too lines do mirror each other.